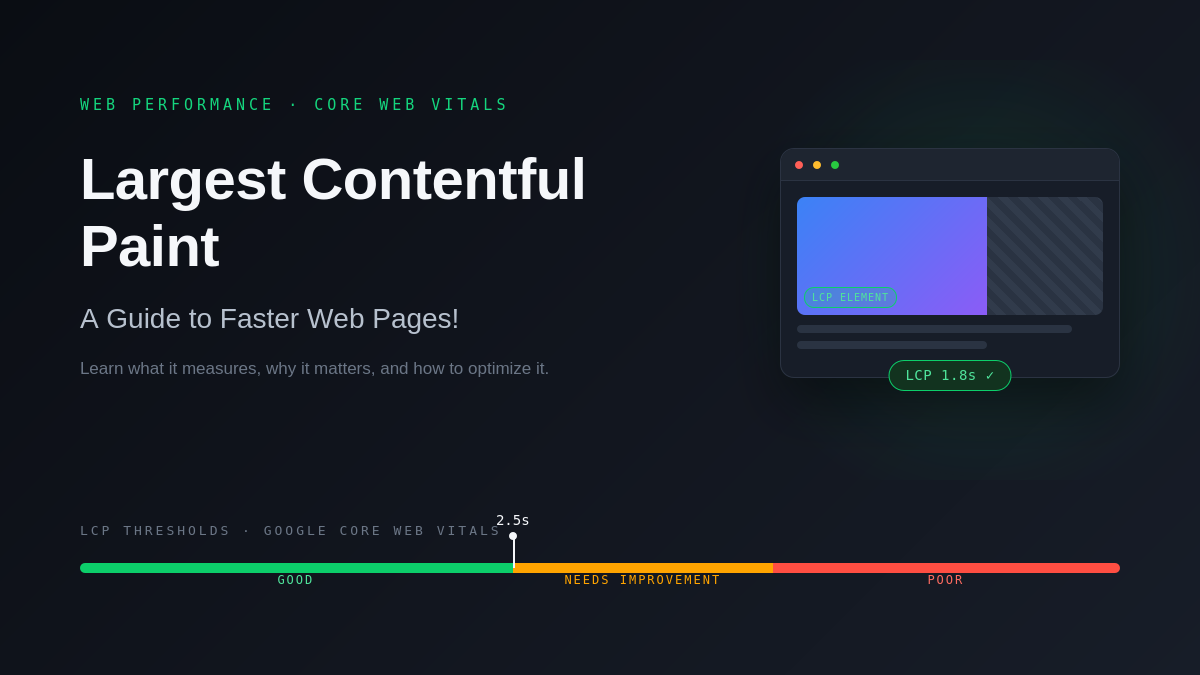
A fast-loading website creates a better experience for users and helps improve search engine rankings. One of the most important metrics in Google's Core Web Vitals is Largest Contentful Paint, which measures how quickly the largest visible element on a webpage loads. A slow loading time can increase bounce rates, reduce conversions, and negatively affect your SEO performance.
Whether you run a blog, business website, or eCommerce store, improving page speed should be a priority. A Technical SEO Audit can also help uncover underlying issues that affect page speed, crawling, indexing, and overall website performance. In this guide, you'll learn what Largest Contentful Paint is, why it matters, the common causes of poor scores, and practical ways to fix them. You'll also learn how to measure this metric using modern performance tools and improve your website for both users and search engines.
What Is Largest Contentful Paint?
Largest Contentful Paint is a Core Web Vitals metric introduced by Google to measure loading performance. It records how long it takes for the largest visible content element within the user's viewport to appear after a page begins loading.
The largest element can be:
- A hero image
- A featured banner
- A large heading
- A background image
- A video poster image
- A block of text
Unlike older page speed metrics, LCP focuses on what users actually see instead of only measuring technical loading events. This makes it a valuable indicator of real-world website performance.
For example, if your homepage displays a large hero banner, Google considers the page loaded only after that banner becomes visible.
What Is a Good LCP Score?
Google classifies LCP into three categories.
Score | Status |
Under 2.5 seconds | Good |
2.5 to 4 seconds | Needs Improvement |
Over 4 seconds | Poor |
The ideal target is below 2.5 seconds for both desktop and mobile users.
How Does Largest Contentful Paint Work?
When someone visits your website, the browser begins downloading HTML, CSS, JavaScript, fonts, and images.
During this process, Google monitors which visible element becomes the largest within the viewport. The time required for that element to fully render becomes the LCP score.
The measurement ends when the largest visible content finishes rendering.
Several factors influence this timing, including:
- Server response time
- Image loading speed
- Render-blocking resources
- CSS delivery
- JavaScript execution
- Browser rendering
- Network performance
Because these components work together, improving page speed requires optimisation across multiple areas.
How to Check Largest Contentful Paint Using Crawlhunt and Fix it?
Monitoring your website regularly is essential for maintaining strong Core Web Vitals and improving user experience. Crawlhunt makes this process simple by combining technical SEO auditing with performance analysis in one dashboard. Follow the steps below to check your website's loading performance and identify opportunities to improve your Core Web Vitals.
Step 1: Create a New Project in Crawlhunt

After logging in to your Crawlhunt account, you'll land on the main dashboard. To begin analysing your website, click the Add New Project button. Enter your website URL (for example, https://yourwebsite.com) and configure the crawl settings based on your requirements. You can choose to scan your entire website or limit the crawl to a specific number of pages if you only want to analyse selected sections.
Next, configure the crawl options, such as following internal links, respecting your robots.txt file, and scanning pages available in your XML sitemap. Once your settings are complete, click Create Project to save the configuration. Crawlhunt will prepare your project and get everything ready for the website crawl, ensuring all important pages are included in the analysis. Following XML Sitemap Best Practices can help search engines discover important URLs and ensure your crawl covers the pages you want to monitor.
Step 2: Run the Website Crawl
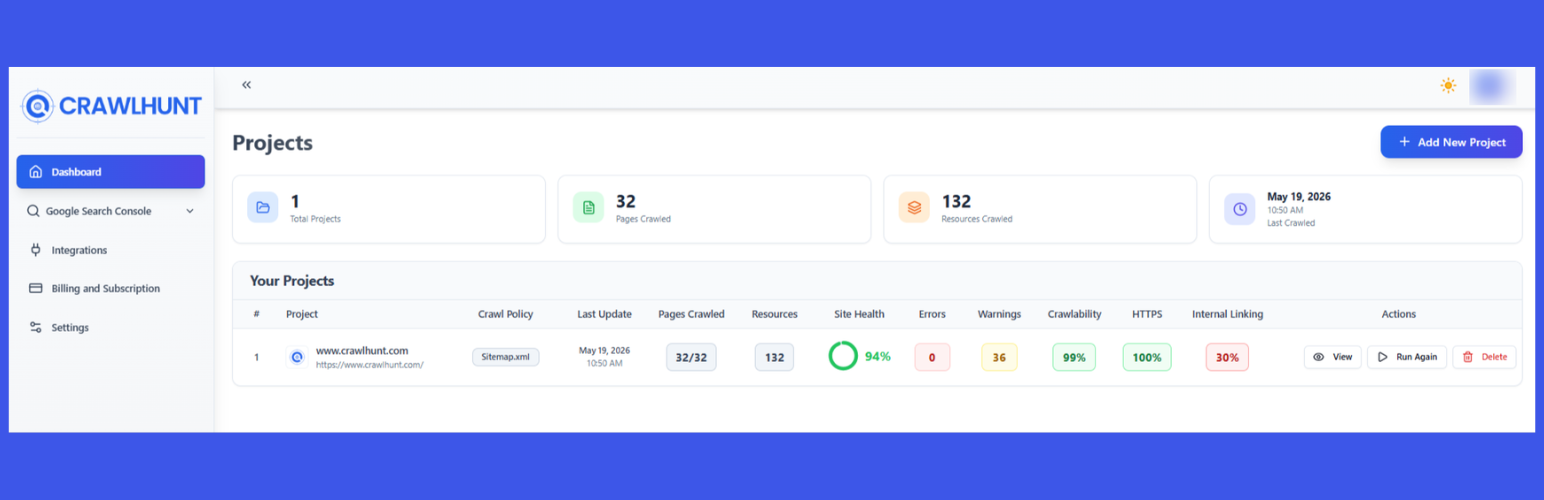
Once the project has been created, Crawlhunt automatically starts crawling your website. During this process, the crawler scans your pages similarly to how search engines analyse websites. It checks page structure, images, metadata, internal links, JavaScript, CSS files, redirects, duplicate content, indexing directives, and other technical SEO elements that may affect website performance. Checking Crawlability and Indexability alongside performance metrics can help ensure that search engines can properly access and understand your important pages.
As the crawl progresses, Crawlhunt collects detailed information about your website's health and Core Web Vitals. Depending on the size of your website, the crawl may take a few minutes to complete. After the scan finishes, Crawlhunt generates a comprehensive SEO report that highlights performance issues and technical improvements. If you make optimisation changes later, you can simply rerun the crawl to compare the updated results with previous reports.
Step 3: Open the SEO Report Dashboard
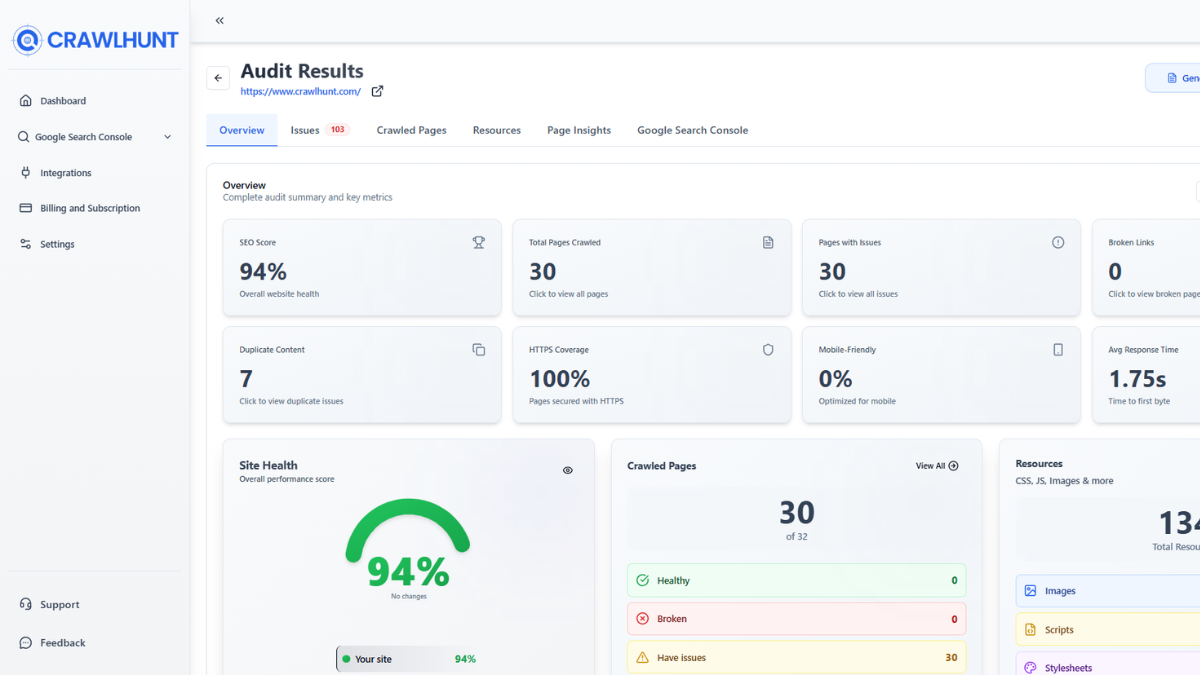
After the crawl is complete, return to your project dashboard and click the View button beside your project. This opens the SEO Report Dashboard, where all the collected data is organised into easy-to-understand sections.
From the dashboard navigation menu, you can access Overview, Issues, Crawled Pages, Resources, Page Insights, and Google Search Console integration. The Overview section provides a summary of your website's overall SEO health, while the Issues section categorises technical problems based on their severity. You can also review individual crawled pages, inspect resources affecting performance, and analyse page-specific insights. This dashboard makes it easy to identify which pages require optimisation before they impact search rankings or user experience.
Step 4: Open Page Insights and Run Performance Analysis
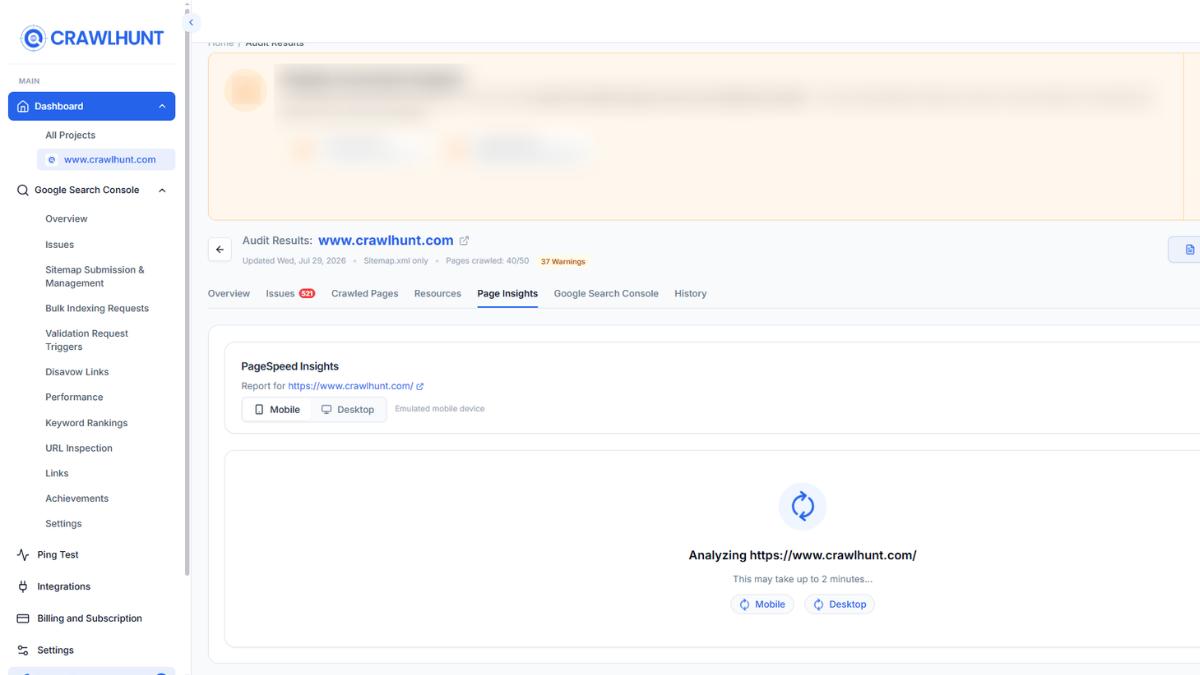
From the left-hand navigation menu, click Page Insights to access detailed performance reports for your website. Locate the page you want to analyse and click the Run Performance button. Crawlhunt will begin generating a Lighthouse performance report, which usually takes a few moments to complete.
Once the analysis finishes, you'll see a comprehensive report containing both real user experience data and laboratory performance metrics. These reports help you understand how quickly your page loads, how stable it is during rendering, and which optimisation opportunities can improve your Core Web Vitals score.
Real User Experience Summary
The report starts with real-world performance data collected from actual users. This section shows whether your website passes Google's Core Web Vitals assessment.
Core Web Vitals Metric | Status | Result |
Core Web Vitals Assessment | ✅ Passed | — |
Largest Contentful Paint (LCP) | Fast | 2120 ms |
Interaction to Next Paint (INP) | Fast | 115 ms |
Cumulative Layout Shift (CLS) | Fast | 0.000 |
When these values appear within Google's recommended thresholds, it indicates that visitors are experiencing a fast, responsive, and visually stable website.
Lighthouse Performance Scores
Below the Core Web Vitals section, Crawlhunt displays Lighthouse category scores that provide an overall evaluation of your website.
Category | Score |
Performance | 75 |
Accessibility | 88 |
Best Practices | 92 |
SEO | 92 |
While the Accessibility, Best Practices, and SEO scores are excellent, the Performance score suggests there are still opportunities to optimise loading speed and page rendering.
Performance Metrics
The Performance report also includes several important loading metrics that help you understand where delays occur during page rendering.
Metric | Result |
First Contentful Paint (FCP) | 2.85 s |
Largest Contentful Paint (LCP) | 5.04 s |
Speed Index | 4.34 s |
Total Blocking Time (TBT) | — |
Cumulative Layout Shift (CLS) | — |
These metrics provide valuable insights into different stages of page loading:
- First Contentful Paint (FCP): Indicates how quickly the browser displays the first visible content, such as text or an image.
- Largest Contentful Paint (LCP): Measures the time required for the largest visible element, such as a hero banner or featured image, to fully render.
- Speed Index: Shows how quickly the visible content is populated during page loading.
- Total Blocking Time (TBT): Highlights delays caused by long-running JavaScript tasks that prevent user interaction.
- Cumulative Layout Shift (CLS): Measures unexpected layout movement while the page loads, helping evaluate visual stability.
Diagnose Performance Issues
The report also includes a Diagnose Performance Issues section that highlights recommendations affecting your website's loading speed and overall quality. Crawlhunt identifies opportunities such as browser console errors, oversized images, render-blocking resources, accessibility issues, incorrect image aspect ratios, heading hierarchy problems, missing iframe titles, low colour contrast, and non-descriptive links. These recommendations make it easier to prioritise fixes that improve both Core Web Vitals and the overall user experience.
By reviewing these reports after every optimisation, you can measure the impact of your changes, monitor performance over time, and ensure your website continues to meet Google's recommended Core Web Vitals standards.
Common Causes of Poor Largest Contentful Paint
Many websites experience slow loading because of technical performance issues. Identifying these problems is the first step toward improving your score.
1. Slow Server Response Time
If your hosting server responds slowly, browsers must wait longer before downloading page resources.
Common reasons include:
- Shared hosting overload
- Poor server configuration
- Lack of caching
- Slow database queries
- Heavy backend processes
A slow server increases loading time before any content appears.
2. Large Images
Oversized images are one of the biggest reasons for poor loading performance.
Examples include:
- High-resolution banners
- Uncompressed hero images
- PNG files where WebP would be better
- Large background images
- Images without responsive sizing
Even a beautiful homepage can become slow if large images are not optimised.
3. Render-Blocking CSS
Browsers cannot display page content until important CSS files finish downloading.
Problems include:
- Large CSS files
- Multiple stylesheets
- Unused CSS
- External CSS dependencies
Reducing unnecessary CSS helps browsers paint visible content much faster.
4. Heavy JavaScript
Large JavaScript files delay rendering because browsers must download, parse, and execute them before displaying content.
Common examples include:
- Large frameworks
- Third-party scripts
- Sliders
- Popups
- Chat widgets
- Tracking scripts
Delaying non-essential JavaScript significantly improves loading speed.
5. Poor Image Optimisation
Images should always be optimised before uploading.
Common mistakes include:
- Uploading original camera images
- Using incorrect dimensions
- Missing lazy loading
- Not compressing images
- Using outdated formats
Modern formats like WebP and AVIF reduce file size while maintaining quality.
6. Slow Web Fonts
Custom fonts can delay rendering when browsers wait for font files.
Issues include:
- Multiple font families
- Too many font weights
- Large font files
- Missing preload attributes
Loading only essential fonts improves rendering performance.
7. Too Many Third-Party Scripts
Marketing and analytics tools often increase loading time.
Examples include:
- Live chat
- Advertising scripts
- Analytics
- Heatmaps
- Social media widgets
- Embedded videos
Only install scripts that provide real business value.
8. No Browser Caching
Without browser caching, returning visitors must download resources again.
Caching stores files such as:
- CSS
- JavaScript
- Images
- Fonts
This significantly reduces repeat loading times.
9. Excessive Redirects
Every redirect adds an extra request before the final page loads.
Examples include:
- HTTP to HTTPS
- Multiple redirect chains
- Old URLs
- Broken redirects
Reducing unnecessary redirects improves page speed.
10. Poor Website Architecture
Large websites often suffer from inefficient structures.
Common issues include:
- Deep page hierarchy
- Excessive plugins
- Duplicate resources
- Bloated themes
- Poor internal linking
A clean website structure helps browsers load content more efficiently. A well-planned Internal Linking Strategy can strengthen site architecture while helping users and search engines navigate important pages more efficiently.
Conclusion
Improving your website's loading performance is essential for delivering a better user experience and maintaining strong search engine rankings. By understanding the factors that affect Largest Contentful Paint, you can identify performance bottlenecks and apply the right optimisations, such as compressing images, reducing render-blocking resources, improving server response times, and minimising unnecessary JavaScript. R
egular performance monitoring is equally important to ensure your website continues to meet Google's Core Web Vitals standards. Tools like Crawlhunt make it easier to analyse page performance, identify technical issues, and track improvements through detailed reports and Page Insights. A faster website not only improves visitor satisfaction but also supports better SEO, higher engagement, and increased conversions. Consistent optimisation and monitoring will help keep your website fast, reliable, and competitive over time.
Frequently Asked Questions (FAQs)
Does Largest Contentful Paint affect mobile and desktop performance?
Yes. LCP is measured separately for mobile and desktop devices because loading behaviour and network conditions vary. Optimising your website for both ensures a better experience for all users.
How often should I monitor Largest Contentful Paint?
It's a good practice to monitor LCP regularly, especially after publishing new content, redesigning your website, installing plugins, or making performance-related changes. Routine monitoring helps maintain strong Core Web Vitals and consistent website performance.
How can I improve Largest Contentful Paint?
You can improve Largest Contentful Paint by optimizing large images, using modern image formats, reducing server response time, enabling browser caching, removing unnecessary scripts, and prioritizing critical resources. A content delivery network can also help deliver assets faster. Regularly testing your pages with performance tools helps identify specific LCP bottlenecks.